

[Editor’s Note: You may have noticed that the site’s sidebar on the right has disappeared for this article. Don’t worry! Endless History isn’t broken! I have removed the sidebar for this article alone to ensure a clean presentation of the graphs and charts in it. The real estate was much needed in some cases. If you need to browse through other places on the site, return to the top of the page and use the menu below the header! Thanks!]
On Nov 9th, Falcom has unveiled the 2017 EOY financial report, along with the forecast and explanation of the said forecast for the 2018 fiscal year. (ed note: Oct 1, 2017 ~ Sept 30, 2018 is the 2018 fiscal year.)
Falcom has credited this year’s numbers to a variety of releases. The Japanese releases for 2017 are as follows:
- Ys VIII -Lacrimosa of Dana- released to the PlayStation 4 in May 2017.
- The Legend of Heroes Sen no Kiseki III released to the PlayStation 4 in Sept 2017.
Additionally, Falcom saw several older titles have English language download-only releases, as well as collaborations with other major game developers. Along with those, the following games were also released internationally:
- Ys VIII on the PlayStation Vita saw releases in Korean, English, and French.
- Ys VIII on the PlayStation 4 saw releases in Chinese, Korean, English, and French.
- Ys Origin saw both Japanese and multilingual releases to PlayStation Vita and PlayStation 4 consoles.
- Tokyo Xanadu for PlayStation Vita saw releases in Chinese, Korean, English, and French.
- Tokyo Xanadu eX+ for PlayStation 4 saw Chinese and Korean releases.
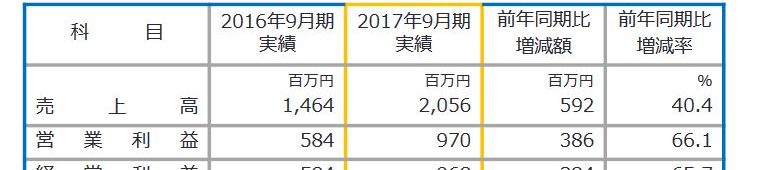
The numbers are listed in the table below:
In one million yen increments.
| Total Sales | Operating Profit | Operating Income | EOY Net Income | |||||
|---|---|---|---|---|---|---|---|---|
| FY 2017 | 2,065 | 40.4% | 970 | 66.1% | 968 | 65.7% | 642 | 66.1% |
| FY 2016 | 1,464 | ? 7.0% | 584 | ? 15.7% | 584 | ? 15.3% | 386 | ? 15.2% |
Falcom’s forecast for 2018 comes from four major points:
- The Sen no Kiseki series- which has been given many awards, including recognition from the Japan Game Awards, the PlayStation Awards, and Famitsu Awards- will see a new title released for the PlayStation 4.
- Sen no Kiseki I and II, which have broken a combined 1,000,000 units worldwide in sales, will be released for the PlayStation 4.
- The company will be engaging in continued sales promotions for the widely well accepted Ys VIII -Lacrimosa of Dana- through the year.
- Falcom will maintain a proactive stance in seeing that their original contents are integrated in collaborative works, as well as new titles released for a variety of platforms and smartphones throughout Japan, Asia, North America, and Europe.
The numbers for the forecast can be found below:
In one million yen increments.
| Period | EOY 2017 Results | EOY 2018 Forecast | Rate of Change |
|---|---|---|---|
| Total Sales | 2,056 | 1,800 | ? 12.5% |
| Operating Profit | 970 | 750 | ? 22.7% |
| Operating Income | 968 | 750 | ? 22.6% |
| Net Income | 642 | 500 | ? 22.2% |
For details of the financial report, please check out the cut below.
Date: 11/9/2017
Listed Company Name: Nihon Falcom
Company Code Number: 37231)Code used on the Tokyo Stock Exchange.
URL: http://www.falcom.co.jp
TEL: 042-527-0555
Delegate: Board Selected President Toshihiro Kondo
Contact Representative: Board Member Takashi Nakano
Scheduled Shareholder Meeting Date: 12/20/2017
Scheduled Dividend Payout Date: 12/21/2017
Scheduled Securities and Bonds Reporting Date: 12/21/2017
Do Supplemental Documents Exist? No
Is A Meeting to Explain Documents Planned? No.
Table of Contents
- Operational Results and Analysis of Financial Condition
- ( 1 ) Analysis Concerning Operational Results
- ( 2 ) Analysis Concerning Financial Condition
- ( 3 ) Policies Regarding Profit Distribution and Analysis of Current and Upcoming Terms
- ( 4 ) Risks to the Company
- State of the Enterprise
- Operational Policies
- ( 1 ) Standard Policies of the Company’s Operations
- ( 2 ) Benchmarks and Operational Indices
- ( 3 ) Mid-to-Long Term Corporate Strategies
- ( 4 ) All Issues Affecting the Enterprise
- ( 5 ) Miscellaneous and Other Important Matters
- Fundamentals on the Selection of Accounting Standards
- Tables for Financial Affairs
- ( 1 ) Balance Sheet
- ( 2 ) Profit and Loss Calculation Sheet
- ( 3 ) Fluctuation Chart for Shareholder Equity
- ( 4 ) Cash Flow Calculation Sheet
- ( 5 ) Annotations Related to Financial Statements
- ( Explanations Related to the Continuation of the Enterprise )
- ( Plans Regarding Important Accounts )
- ( Changes to Account Objectives )
- ( Additional Information )
- ( Concerning the Profit and Loss Statement )
- ( Concerning the Chart Showing Fluctuations to Shareholder Equity )
- ( Concerning the Cash Flow Statement )
- ( Concerning Financial Products )
- ( Concerning Tax Accounts )
- ( Other Segment Information )
- ( Profit and Loss Regarding Corporate Equity Principles )
- ( Information on Related Parties )
- ( Information on 1 Share Amounts )
- ( Essential Late-Starting Events )
- ( 6 ) Miscellaneous
1. Operational Results and Analysis of Financial Condition
( 1 ) Analysis Concerning Operational Results
1. Financial Results
In the game industry, mobile gaming continues its growth. For console gaming in both domestic and foreign markets2)as a note, this is from a Japanese standpoint- ‘domestic’ is for Japan the PlayStation 4 has become more popular and commonplace. Additionally, the Nintendo Switch that was released in March 2017 has seen favorable sales as well. The competition with these two systems has fostered a market of excellent titles.
This company continued to create game software to draw in for many more users to enjoy, and production continues onward.
As such, this year both Ys VIII -Lacrimosa of Dana, and the Legend of Heroes Sen no Kiseki III were released for the PlayStation 4.
Additionally, many contents by this company were used one after another for various smartphone apps and online games. There was an increase in miscellaneous DLC and collaborative contents, live concerts, and all kinds of events were promoted.
Due to these, total sales for this company were at 2,065 million yen3)approx. $18,340,000, as of 12/15/2017 (an increase of 40.4% from last year), an operating income of 968 million yen4)approx. $8,600,000 as of 12/15/2017 (an increase of 65.7% from last year), and a net income of 642 million yen5)approx. $5,700,000 as of 12/15/2017, (an increase of 66.1% from last year).
Manufactured Goods Division
This fiscal year saw the release of Ys VIII -Lacrimosa of Dana for the PlayStation 4 in May 2017. This is a new title in the Ys action RPG series, which has become loved by many fans since its first title in 1987 through postive reviews and word of mouth.
Additionally, the Sen no Kiseki series6)Trails of Cold Steel in English, which has seen over 1 million copies sold worldwide through its first two titles had its third game, The Legend of Heroes Sen no Kiseki III, released in September 2017. This title has gained quick popularity and was awarded the Japan Game Award for Future titles at Tokyo Game Show 2017.
As a result, the manufactured goods division brought in a total of 1,143 million yen7)approx. $10,150,000 as of 12/15/2017, an increase of 39.9% from last year.
Licensing Division
Contents from this company being released on multiple platforms and regions, as well as permissions being granted for other companies to license and use characters created by this company affect this division’s numbers. In this situation, Ys VIII -Lacrimosa of Dana- was released in Korean, English, and French for the PlayStation Vita. Ys Origin also saw a PlayStation Vita and PlayStation 4 release in Japan and a variety of other languages.
Additionally, Tokyo Xanadu was released for PlayStation Vita in Chinese, Korean, and English with Tokyo Xanadu eX+ being released for PlayStation 4 in Chinese and Korean. The Nintendo 3DS also saw the release of Gurumin 3D in both English and Japanese.
In May 2017, Chinese and Korean language versions of Ys VIII -Lacrimosa of Dana- were released to the PlayStation 4 simultaneously with the Japanese release, and an English language version of the title was released in Sept 2017.
Other events were the releases of multiple older PC titles through English language game download services, the online story RPG Akatsuki no Kiseki, and collaborative contents added to Hortensia Saga, Seven Nights, Lapis Chronicle, and other titles. Through these efforts, the company has drawn in more users.
As a result, the licensing division brought in a total of 913 million yen8)approx. $8,100,000 as of 12/15/2017, an increase of 41.1% from last year.
2. Forecast for Next Term
The next term will see the continuation of the Sen no Kiseki series with the new title being released to PlayStation 4. There are plans for Sen no Kiseki and Sen no Kiseki II to also see PlayStation 4 releases, as well.
The Kiseki series is one of this company’s masterpiece works, having a large number of fans and having received many awards, including the Japan Game Award of Excellence, the Japan Game Award for Future Titles, the Famitsu Award, PlayStation User’s Choice Award, and others. Other games in the series include Sora no Kiseki FC, Sora no Kiseki SC, Sora no Kiseki the 3rd, Zero no Kiseki, and Ao no Kiseki. This particular series, Sen no Kiseki, has had two other titles sell over 1 million copies world wide, and just saw the release of its third title, Sen no Kiseki III in this past year.
In regards to the highly praised Ys VIII -Lacrimosa of Dana- this company plans to make an effort to ensure the title has continued sales promotions throughout the year.
For the licensing division, contents from this company will be released to multiple platforms and in smartphone apps throughout Japan, Asia, North America, and Europe. Additionally, collaborative efforts for various apps will continue as well.
For the term ending in 9/2018, this company is forecasting a total sales of 1,800 million yen9)approx. $15,980,000 as of 12/15/2017, an operating income of 750 million yen10)approx. $6,660,000 as of 12/15/2017, and a net income of 500 million yen11)approx $4,440,000 as of 12/15/2017.
Furthermore, a distinctive trait of the financial results is due to the general months of release. As most of the financial numbers come about from the second half of the year, the results are heavily weighted towards the last two quarters of the year.
( 2 ) Analysis Concerning Financial Condition
1. Property, Liabilities, and Net Worth
When compared to last year, this company’s assets have increased 867 million yen to 5,023 million yen12)approx. $44,600,000 as of 12/15/2017. The primary causes for this were an increase of cash on hand to 34 million yen and an increase to accounts receivable to 824 million yen.
In terms of liabilities, this fiscal year saw a 297 million yen increase to 612 million yen13)approx. $5,430,000 as of 12/15/2017. The primary causes for this would be from accounts payable increasing to 122 million yen14)approx. $1,080,000 as of 12/15/2017, and unpaid corporate taxes increasing to 149 million yen15)approx. $1,320,000 as of 12/15/2017.
This company’s net worth has increased 570 million yen to 4,410 million yen16)approx. $39,160,800 as of 12/15/2017, caused by surplus shares increasing to 71 million yen17)approx. $630,000 as of 12/15/2017. This ends up with a current net income of 642 million yen18)approx. $5,700,000 as of 12/15/2017.
2. Situation with Cash Flow
Cash and cash equivalent goods (futhermore known as ‘capital.’) increased this year by 34 million yen, to 3,847 million yen19)approx $34,160,000 as of 12/15/2017.
Information regarding this fiscal year’s cash flow follows.
(Cash flow from business activities.)
Due to this year’s business activities, the company’s capital has increased to 113 million yen. The cause for this is from paying 187 million yen in corporate taxes, and a total credit increase to 824 million yen. This year’s net income is 968 million yen20)approx. $8,600,000 as of 12/15/2017 before taxes.
(Cash flow from investment activities.)
There was a decrease of 6 million yen through investment activities. This is based on the value of tangible fixed assets.
(Cash flow from financial activities.)
There was a 71 million yen reduction in capital from financial activities. This is caused by divident expenses being at 71 million yen.
(Reference) Transition of Related Cash Flow Indices
| 2013 Term | 2014 Term | 2015 Term | 2016 Term | 2017 Term | |
|---|---|---|---|---|---|
| Capital-to-Asset Ratio | 78.2 | 75.4 | 91.4 | 92.4 | 87.8 |
| Capital-to-Asset Ratio of Market Value Base |
382.5 | 367.5 | 265.7 | 154.6 | 206.9 |
| Ratio of Interest Bearing Debt Against Cash Flow |
— | — | — | — | — |
| Interest Coverage Ratio | — | — | — | — | — |
(Annotation) Capital-to-Asset Ratio: Net Worth / Total Assets
Capital-to-Asset Ratio of a Market Value Base : Stock Market Cap / Total Assets
Ratio of Interest Bearing Liabilities against Cash Flow : Interest Bearing Liabilities / Operational Cash Flow
Interest Coverage Ratio : Operational Cash Flow / Interest Payment
1. Stock Market Cap is calculated by (Stock Closing Price at End of Term) x (End of Term Issued Stock Count)
2. Ratio of Interest Bearing Debt Against Cash Flow and Interest Coverage Ratio were not recorded for the terms listed above.
( 3 ) Policies Regarding Profit Distribution and Analysis of Current and Upcoming Terms
Management takes the shareholder concerns of profit returns as an important subject. When considering profit distribution, we have to take into account future enterprise developments, as well as the required internal reserves to ensure long-term business reinforcement.
In line with these requirements, we have opted dividend payouts to be 8 yen per share.
( 4 ) Risks to the Company
The section below details the potential risks that can befall the company and its development activities. While these things may not necessarily be actively impacting the company, these are things that investors must be made aware of, so that they can be proactive in their decision making. Additionally, it’s in the company’s best interests to be aware of these potential risks so that it can either avoid them entirely, or react appropriately should they happen. Please take these issues into account when making decisions regarding the company’s stocks.
1. Risks Within the Company
a. Lengthening Development Times
Currently for this company, game software development can be as short as half a year to taking 2 or 3 years. There can be differences between what is the planned development time and what is considered as practical development times. Furthermore, development times can also increase from the recent speed of technological advancements as well as increasing demand for manufactured goods. This company works to counteract this by continuously gathering as much information as possible regarding technology advancements in this industry.
b. Trends Changing the Sales of Manufactured Goods
The fiscal quarters for this company rely heavily on the release and positive sales of its manufactured goods and the need to continuously bring out new items for sale. As such, it’s fully possible for financial results to change based entirely on the quarterly sales.
c. Issues Involving Intellectual Property
As this company relies on the intellectual property that is developed within it, a lot of care is taken to ensure that these products are not used without obtaining the proper rights for them. Should the case of another company utilizing the know-how, technology, or patented rights of this company, it could have an affect on this company’s financial results.
Furthermore, all manufactured products for this company are handled by third parties. Should an issue involving the company’s intellectual property arise, lawsuits or claims will be necessary to handle it, and this can impact the period’s results.
d. Securing and Training Personnel
One of the most important factors for the company is recruiting and securing personnel and in particular individuals who are both skilled in the current technologies, as well as those that can be easily trained are essential in being hired to bolster the current staff on hand. Moreover, reward programs to recognize achievements are necessary to implement in order to minimize the numbers that would leave the company outside of retirement and career changes. Additionally, because of the use of personnel recruiting services, the objective is to retain as many employees as possible. However, it is impossible to guarantee the ability to continously secure new personnel. As such, missed opportunities in this area have the ability to impact the financial results of this company.
2. Risks Based on External Influences
a. Concerns Regarding Regulation
This company currently does not create products that are rated as ‘R18’ (based on film moral standards determined by the regulations from an official management commitee and are deemed inappropriate for consumers below the age of 18). However, the possibility of strengthened regulations from the government on such topics have the potential to impact the company.
b. Piracy of Game Software
Piracy and non-consentual copies of game software is currently a major problem that is being seen by the video game industry. Currently, as the company has no special actions for dealing with piracy, an overwhelming number of illegal copies can damage potential sales and cause a negative effect on the company’s end of period results.
c. Handling of Personal Information
Part of this company’s services include mail order sales and as a result, we possess personal information on direct customers. Additionally, as more people sign up for the email service offered on the website, this company maintains an in-house database to store the personal information for this use. We have a high awareness of information management, and access restrictions in place so that we can ensure that this personal information is not disclosed.
However, in the situation that personal information is leaked through internal situation or outside hacking, public confidence on this company would be lost, and the resulting damages would have the ability to impact the firm’s financial results.
2. State of the Enterprise
As there are no affiliate corporations connected to this company, there is no relevant information for this.
3. Operational Policies
( 1 ) Standard Policies of the Company’s Operations
This company holds individual creativity in high-regard and encourages affective teamwork so that game contents and services filled with originality can be created. This company strives to continuously boost appealing contents over multiple platforms for the enjoyment of customers worldwide.
( 2 ) Benchmarks and Operational Indices
Because of the efficiency of its management policies, this company maintains a high profit ratio, which gives it the opportunity to focus on strengthening its sales for contents and services.
( 3 ) Mid-to-Long Term Corporate Strategies
Since the formation of this company, the management has always followed a balanced ‘offensive and defensive’ strategy to cultivate a foundation of both know-how and branding. ‘Offensive’ in taking on new challenges to focus on innovative technological developments for console, social, and network gaming. Additionally, the ‘defensive’ aspect is to maintain a healthy speed, and always show improvements in quality while being prepared to deal with issues involving internal themes and personnel. Because of these methods, the company can continue its growth while maintaining a stable foundation underneath its feet.
( 4 ) All Issues Affecting the Enterprise
1. Development of Human Resources
To remain competitive alongside other content makers, this company commits to recruiting and training skilled personnel. This company has a great tradition of long-standing veterans in the game industry with a great deal of know-how, skills, and values, training of the new personnel is a very important issue that the deals with.
2. Speedy Operation and Implementation
This company has a business cycle of planning, development, public relations, and sales. The company realizes that these cycles must be handled quickly, as the pace to supply games and services increases.
3. Brand Evolution
This firm develops an extensive list of game contents and licensing for a variety of platforms, including PC, home consoles, smartphones and online games. With in-house developments and licensed goods performing well both domestically and internationally, this firm can strengthen brand recognition in order to maximize profits.
4. Advertising and Public Relations
To expand the knowledge of this company’s games and services and to ascertain cost-effectiveness for the company, advertising and public relations will need to be reinforced. As the public becomes more aware of the company, more license agreements can be made, more corporate tie-ins, and more job-seekers will apply which will allow the company to push towards more lucrative developments
( 5 ) Miscellaneous and Other Important Matters
There is no relevant information.
4. Fundamentals on the Selection of Accounting Standards
As this firm does not prepare consolidated financial statements, there has been consideration on using international standards for drawing up said statements, but they were instead prepared using Japanese standards.
5. Tables for Financial Affairs
( 1 ) Balance Sheet
| Prev. Year (2016) | Current Year (2017) | |
|---|---|---|
| Property Division | ||
| Current Assets | ||
| Cash on Hand | 3,812,687 | 3,847,502 |
| Accounts Receivable | 137,653 | 961,969 |
| Manufactured Goods | 1,301 | 3,053 |
| Raw Materials | 1,994 | 3,311 |
| Prepaid Expenses | 4,399 | 6,468 |
| Deferred Tax Assets | 36,598 | 26,154 |
| Misc. | 1,281 | 911 |
| Current Assets Sum | 3,995,916 | 4,849,371 |
| Fixed Assets | ||
| Tangible Property | ||
| Facilities Related Installations | 16,281 | 16,281 |
| Total Depreciation Amount | ? 13,895 | ? 14,698 |
| Facilities Related Installations (Net Amount) |
2,386 | 1,582 |
| Tools, Equipment, and Furnishings | 27,977 | 33,949 |
| Total Depreciation Amount | ? 25,798 | ? 28,492 |
| Tools, Equipment, and Furnishings (Net Amount) |
2,178 | 5,457 |
| Fixed Assets Sum | 4,564 | 7,040 |
| Intangible Fixed Assets | ||
| Software | 2,453 | 776 |
| Telephone Procurement | 757 | 757 |
| Intangible Fixed Assets Sum | 3,210 | 1,533 |
| Assets from Additional Investments | ||
| Security Investments | 116,578 | 116,578 |
| Deferred Tax Assets | 4,927 | 18,797 |
| Securities and Deposits | 30,680 | 30,347 |
| Sum of Assets from Additional Investments | 152,185 | 165,723 |
| Sum of Fixed Assets | 159,961 | 174,297 |
| Total Assets | 4,155,977 | 5,023,668 |
| Debt Division | ||
| Current Liabilities | ||
| Accounts Payable | 22,952 | 145,055 |
| Arrears | 60,235 | 58,923 |
| Accrued Expenses | 14,332 | 17,277 |
| Unpaid Corporate Taxes | 150,838 | 300,483 |
| Unpaid Consumption Taxes | 41,108 | 61,197 |
| Advances Received | 2 | — |
| Deposits | 5,870 | 5,802 |
| Reward Provisions | 20,250 | 24,000 |
| Sum of Current Liabilities | 315,590 | 612,739 |
| Total Debts | 315,590 | 612,739 |
| Net Worth Division | ||
| Shareholder Equity | ||
| Capital Stock | 164,130 | 164,130 |
| Capital Surplus | ||
| Capital Reserve Fund | 319,363 | 319,363 |
| Sum of Capital Surplus | 319,363 | 319,363 |
| Profit Surplus | ||
| Miscellaneous Profit Surplus | ||
| Contingent Reserve | 710,000 | 710,000 |
| Transferred Profit Surplus | 2,646,910 | 3,217,553 |
| Sum of Profit Surplus | 3,356,910 | 3,927,553 |
| Treasury Stock | ? 117 | ? 117 |
| Sum of Shareholder Equity | 3,840,286 | 4,410,929 |
| Total Net Worth | 4,115,887 | 5,023,668 |
( 2 ) Profit and Loss Calculation Sheet
| Prev. Year (2016) | Current Year (2017) | |
|---|---|---|
| Sales | ||
| Sales of Manufactured Goods | 817,068 | 1,143,324 |
| Royalty Income | 647,113 | 913,059 |
| Total Sales | 1,464,182 | 2,056,383 |
| Cost of Sales | ||
| Cost of Sales for Manufactured Goods | ?1 260,976 | ?1 317,249 |
| Cost of Sales for Royalty Income | 1,500 | 3,000 |
| Total Cost of Sales | 262,476 | 320,249 |
| Total of All Sales | 1,201,706 | 1,736,134 |
| Sales and Administrative Costs | ||
| Shipping and Freight Costs | 10,603 | 10,431 |
| Advertising Expenses | 91,014 | 53,921 |
| Promotional Costs | 15,643 | 29,338 |
| Executive Salary | 50,822 | 50,000 |
| Employee Salary and Wages | 24,251 | 25,766 |
| Bonuses | 2,900 | 2,870 |
| Sums Transferred into Bonus Reserves | 2,295 | 2,624 |
| Legal Costs | 12,315 | 12,255 |
| Hiring Costs | 12,643 | 11,721 |
| Utility Costs | 878 | 936 |
| Payment Handling | 33,323 | 35,599 |
| Supply Expenses | 1,415 | 1,381 |
| Travel Expenses | 1,628 | 1,575 |
| Communication Expenses (Postage) | 585 | 559 |
| Depreciation Costs | 1,508 | 1,596 |
| Research and Development | ?2 343,007 | ?2 500,790 |
| Miscellaneous | 12,536 | 24,182 |
| Sum of Sales and Administrative Costs | 617,374 | 765,552 |
| Operating Profit | 584,331 | 970,581 |
| Earnings from Outside the Business | ||
| Interest Receipts | 349 | 36 |
| Dividend Receipts | 572 | 1,155 |
| Excluded Profits from Unpaid Dividends | 702 | 1,046 |
| Sum of Earnings from Outside the Business | 1,623 | 2,238 |
| Costs from Outside the Business | ||
| Losses from Foreign Exchange | 1,576 | 4,373 |
| Sum of Costs from Outside the Business | 1,576 | 4,373 |
| Current Profits | 584,378 | 968,446 |
| Special Costs | ||
| Costs from Eliminating Fixed Assets | — | 0 |
| Sum of Special Costs | — | 0 |
| Current Income Before Taxes | 584,378 | 968,446 |
| Corporation, Municipal, and Enterprise Taxes | 194,777 | 329,270 |
| Sum of Adjustments from Corporation Tax | 2,693 | ? 3,426 |
| Sum of Taxes | 197,471 | 325,844 |
| Current Net Income | 386,907 | 642,601 |
Detailed Statement on the Total Sale of Manufactured Goods
Detailed Statement on the Total Sale of Manufactured Goods
| Operation Section | Previous Year (2016) | Current Year (2017) | ||
|---|---|---|---|---|
| Section | Amount | Ratio (%) | Amount | Ratio (%) |
| I. Material Cost | 225,991 | 87.0 | 287,368 | 90.1 |
| II. Outsourcing Cost | 33,737 | 13.0 | 31,633 | 9.9 |
| SUBTOTAL | 259,789 | 100.0 | 319,001 | 100.0 |
| III. Inventory Count of Goods at Beginning of Term |
2,487 | 1,301 | ||
| SUM TOTAL | 262,277 | 320,303 | ||
| IV. Inventory Count of Goods at End of Term |
1,301 | 3,053 | ||
| Difference in Costs of Goods |
260,976 | 317,249 | ||
( 3 ) Fluctuation Chart for Shareholder Equity
Previous Term: From Oct 1, 2015 ~ Sept 30, 2016
In thousand yen increments.
| Shareholder Equity | Sum of Net Worth | ||||||
|---|---|---|---|---|---|---|---|
| Capital Stock | Capital Surplus | Profit Surplus | Treasury Stock | Sum of Capital Stock | |||
| Capital Reserve | Misc. Profit Surplus | ||||||
| Special Reserve | Transferred Profit Surplus | ||||||
| Current Term Balance | 164,130 | 319,363 | 710,000 | 2,331,962 | ? 117 | 3,525,338 | 3,525,338 |
| Change of Sums in Current Term | |||||||
| Surplus Shares | ? 71,959 | ? 71,959 | ? 71,959 | ||||
| Current Net Income |
386,907 | 386,907 | 386,907 | ||||
| Sum of Fluctuations For the Current Period |
— | — | — | 314,948 | 914,948 | 314,948 | |
| Balance at the end of this Period |
164,130 | 319,363 | 710,000 | 2,646,910 | ? 117 | 3,840,286 | 3,840,286 |
Current Term: From Oct 1, 2016 ~ Sept 30, 2017
In thousand yen increments.
| Shareholder Equity | Sum of Net Worth | ||||||
|---|---|---|---|---|---|---|---|
| Capital Stock | Capital Surplus | Profit Surplus | Treasury Stock | Sum of Capital Stock | |||
| Capital Reserve | Misc. Profit Surplus | ||||||
| Special Reserve | Transferred Profit Surplus | ||||||
| Current Term Balance | 164,130 | 319,363 | 710,000 | 2,646,910 | ? 117 | 3,840,286 | 3,840,286 |
| Change of Sums in Current Term | |||||||
| Surplus Shares | ? 71,959 | ? 71,959 | ? 71,959 | ||||
| Current Net Income |
642,601 | 642,601 | 642,601 | ||||
| Sum of Fluctuations For the Current Period |
— | — | — | 570,642 | 570,642 | 570,642 | |
| Balance at the end of this Period |
164,130 | 319,363 | 710,000 | 3,217,553 | ? 117 | 4,410,929 | 4,410,929 |
( 4 ) Cash Flow Calculation Sheet
| Prev. Year (2016) | Current Year (2017) | |
|---|---|---|
| Cash Flow from Business Activities | ||
| Current Net Income Before Taxes | 584,378 | 968,446 |
| Depreciation Costs | 5,375 | 6,064 |
| Reduction of Fluctuations of Reward Reserves (? is decrease) |
— | 3,750 |
| Interest and Dividend Receipts | ? 921 | ? 1,191 |
| Loss from Elimination of Fixed Assets | — | 0 |
| Reduction of Fluctuations in Sales Credit (? is increase) |
448,993 | ? 824,317 |
| Reduction of Fluctuations in Inventory Assets (? is increase) |
2,999 | ? 3,069 |
| Fluctuation Amounts of Other Assets (? is increase) |
479 | ? 1,367 |
| Reduction of Fluctuations in Purchased Debts (? is decrease) |
? 84,378 | 112,102 |
| Reduction of Fluctuations of Arrears (? is decrease) |
? 10,102 | ? 847 |
| Fluctuation Amounts of Unpaid Taxes (? is decrease) |
11,605 | 20,089 |
| Fluctuation Amounts of Other Debts (? is decrease) |
1,618 | 10,141 |
| Subtotal | 960,048 | 299,800 |
| Amounts Received via Interests and Dividends | 921 | 1,191 |
| Amount Paid for Corporation Tax | ? 129,418 | ? 187,936 |
| Cash Flow from Business Activities | 831,552 | 113,055 |
| Cash Flow from Investment Activities | ||
| Expenses from the Value of Tangible Assets | — | ? 6,862 |
| Expenses from the Value of Intangible Assets | ? 387 | — |
| Other | 63 | — |
| Cash Flow from Investment Activities | ? 324 | ? 6,862 |
| Increased Reduction in Cash and Cash Value Articles (? is decrease) |
759,738 | 34,815 |
| Balance of Cash and Cash Value Articles at Start of Term | 3,052,949 | 3,812,687 |
| Balance of Cash and Cash Value Articles at End of Term | 3,812,687 | 3,847,502 |
( 5 ) Annotations Related to Financial Statements
(Annotations Concerning Business Condition Continued)
No applicable information.
(Important Accounting Policies)
1. Appraisal Standards and Evaluation Policies for Marketable Securities
Other Marketable Securities
There are no market value items.
Moving average is calculated via cost price.
2. Appraisal Standards and Evaluation Policies for Inventory Assets
Manufactured goods and raw services.
Utilizing previously mentioned cost price ( calculations based on the declining book value of profitability) principles.
3. Depreciation Estimates Process for Fixed Assets
( 1 ) Tangible fixed assets
Using a fixed rate. (based on building installation value laws instated on 4/1/2016)
Below is the average service life.
Building Installations: 10 ? 15 years
Tools, Devices, and Furnishings: 4 ~ 8 years
( 2 ) Intangible fixed assets
Based on the in-house availability (5 years) of software used in the corporation.
4. Appropriation Standards for Reserves
( 1 ) Irrecoverable debt reserves
Prepared to have ready for losses caused by irrecoverable debt from credits. There is a considered ratio for irrecoverable debt to go along with the general credit, as such this is a sum of money to maintain for the times when it’s impossible to claim a debt.
( 2 ) Bonus reserves
Provisioned expenditures set aside to give to employees as a reward.
5. Scope Regarding Funds in the Cash Flow Statement
Cash on hand is made up of money that can be quickly withdrawn, and items that can be easily liquidated, moreover the company takes responsibility for small risks from value fluctuations that can be paid off anywhere between three days to three months.
6. Important Notes Involving the Standards for Drawing up Other Financial Statements
Accounting of consumption tax: based on formulas that include tax amounts.
( Changes to Account Objectives )
No applicable information.
( Additional Information )
(Concerning the application of potentially reclaimed DTA.)
This fiscal year’s process of “applying potentially reclaimed DTA” (Based on standard corporate indices from 3/28/2014)
( Concerning the Profit and Loss Statement )
? 1 Inventory that fell below the targeted sales goals.
| Prev. Term 10/1/2015~9/30/2016 |
Current Term 10/1/2016~9/30/2017 |
|
| Cost of Sales | 3,422 thousand yen | 1,500 thousand yen |
???Sum of Research and Development Costs
| Prev. Term 10/1/2015~9/30/2016 |
Current Term 10/1/2016~9/30/2017 |
|
| Distribution and Administrative Costs |
343,007 thousand yen | 500,790 thousand yen |
( Concerning the Chart Showing Fluctuations to Shareholder Equity )
Prev. Fiscal Year (10/1/2015 ~ 9/30/2016)
1. Concerning the counts of both general and treasure stocks.
| Stock at Beginning of this Year | Stock Increase for this Year | Stock Decrease for this Year | Max Stock for this Year | |
|---|---|---|---|---|
| Issued Stock | ||||
| General Stock | 10,280,000 | — | — | 10,280,000 |
| Treasury Stock | ||||
| General Stock | 102 | — | — | 102 |
2. Information Related to Dividends
( 1 ) Dividend Payouts
| Decision | Stock Category | Dividend Total (1000 yen increments) | Dividend Amount per Share | Reference Date | Effective Date |
|---|---|---|---|---|---|
| 12/16/2015 Regular Shareholder Meeting |
General Stock | 71,959 | 7 | 9/30/2015 | 12/17/2015 |
( 2 ) Stocks for the current term belonging under the reference date, and the effective date of stock for the next term.
| Decision | Stock Category | Dividend Total (1000 yen increments) | Dividend Amount per Share | Dividend Capital | Reference Date | Effective Date |
|---|---|---|---|---|---|---|
| 12/20/2016 Regular Shareholder Meeting |
General Stock | 71,959 | 7 | Profit Surplus | 9/30/2016 | 12/21/2016 |
This Fiscal Year (10/1/2016 ~ 9/30/2017)
1. Concerning the counts of both general and treasure stocks.
| Stock at Beginning of this Year | Stock Increase for this Year | Stock Decrease for this Year | Max Stock for this Year | |
|---|---|---|---|---|
| Issued Stock | ||||
| General Stock | 10,280,000 | — | — | 10,280,000 |
| Treasury Stock | ||||
| General Stock | 102 | — | — | 102 |
2. Information Related to Dividends
( 1 ) Dividend Payouts
| Decision | Stock Category | Dividend Total (1000 yen increments) | Dividend Amount per Share | Reference Date | Effective Date |
|---|---|---|---|---|---|
| 12/20/2016 Regular Shareholder Meeting |
General Stock | 71,959 | 7 | 9/30/2016 | 12/21/2016 |
( 2 ) Stocks for the current term belonging under the reference date, and the effective date of stock for the next term.
| Decision | Stock Category | Dividend Total (1000 yen increments) | Dividend Amount per Share | Dividend Capital | Reference Date | Effective Date |
|---|---|---|---|---|---|---|
| 12/20/2017 Regular Shareholder Meeting |
General Stock | 82,239 | 8 | Profit Surplus | 9/30/2017 | 12/21/2017 |
( Concerning the Cash Flow Statement )
Concerning end of term balance of cash and cash equivalent goods, as well as topics documented on the balance sheet.
(In thousand yen increments)
| Prev. Year (10/1/2015 ~ 9/30/2016) |
This Year (10/2/2016 ~ 9/20/2017) |
|
|---|---|---|
| Cash on Hand | 3,812,687 | 3,847,502 |
| Cash and Cash Equivalent Items | 3,812,687 | 3,847,502 |
( Concerning Financial Products )
As the document regarding the summary of accounts does not have a high monetary requirement, it is not displayed here.
( Concerning Tax Accounts )
1. Itemization of the main source of DTA generation
In Thousand Yen Increments
| Prev. Year (9/30/2016) | This Year (9/30/2017) | |
|---|---|---|
| (Deferred Tax Assets / DTA) | ||
| 1. Current Assets | ||
| Unfactored loss from unpaid corporate taxes | 8,890 | 13,088 |
| Unfactored loss from bonus reserves | 6,249 | 7,406 |
| Unfactored loss from inventory value | 1,463 | 1,650 |
| Miscellaneous | 15,829 | 1,611 |
| Total | 36,598 | 26,154 |
| 2. Fixed Assets | ||
| Depreciation Surplus | 2,386 | 14,693 |
| Miscellaneous | 2,541 | 4,104 |
| Total | 4,927 | 18,797 |
| Sum of DTA | 41,526 | 44,952 |
| Net Amount of DTA | 41,526 | 44,952 |
2. Comparison of the taxation applied on primary items, to the tax rates as mandated by law21)thanks to Sniff the Raven for assisting me with this to try to make this financial jargon word salad sound less like a word salad..
| Prev. Year (9/30/2016) | This Year (9/30/2017) | |
|---|---|---|
| Legal Tax Rate | —% | 30.9% |
| (Adjustments) | ||
| Charged Taxes on Reserve Cash of Affiliated Corporations | —% | 5.2% |
| Tax Credits of Trial Expenses | —% | 2.3% |
| Miscellaneous | —% | ? 0.2% |
| Corporation’s Share of Taxes after Applied Tax Results | —% | ? 33.6% |
( Other Segment Information )
[Segment Information]
This company is only involved in game development and sales. Any other segments have been omitted.
[Relevant Information]
Prev. Fiscal Year (10/1/2015 ~ 9/30/2016)
1. Information on Manufactured Goods and Other Services
In thousand yen increments
| Manufactured Goods Div. | Licensed Goods Div. | Total | |
|---|---|---|---|
| Total Sales of External Clients | 817,068 | 647,113 | 1,464,182 |
2. Regional Information.
( 1 ) Total Sales
In thousand yen increments
| Japan | Asia | North America / Europe | Total |
|---|---|---|---|
| 1,187,247 | 37,322 | 239,613 | 1,464,182 |
Note: The information is based on client sales, sorted by region.
( 2 ) Tangible Fixed Assets
As there are no tangible fixed assets outside of the region, there is no relevant information.
3. Major Client Information
In thousand yen increments
| Major Client Name | Total Sales | Related Segment Name |
|---|---|---|
| Konami Digital Entertainment | 694,711 | Game Development / Sales |
| Sony Interactive Entertainment | 282,677 | Game Development / Sales |
| Marvelous USA, INC. | 156,151 | Game Development / Sales |
This fiscal year. (10/1/2016 ~ 9/30/2017)
1. Information on Manufactured Goods and Other Services
In thousand yen increments
| Manufactured Goods Div. | Licensed Goods Div. | Total | |
|---|---|---|---|
| Total Sales of External Clients | 1,143,324 | 913,059 | 2,056,383 |
2. Regional Information.
( 1 ) Total Sales
In thousand yen increments
| Japan | Asia | North America / Europe | Total |
|---|---|---|---|
| 1,725,257 | 24,231 | 306,894 | 2,056,383 |
Note: The information is based on client sales, sorted by region.
( 2 ) Tangible Fixed Assets
As there are no tangible fixed assets outside of the region, there is no relevant information.
3. Major Client Information
In thousand yen increments
| Major Client Name | Total Sales | Related Segment Name |
|---|---|---|
| Konami Digital Entertainment | 1,055,089 | Game Development / Sales |
| Sony Interactive Entertainment | 490,547 | Game Development / Sales |
[Information based on losses from fixed assets in reported segments.]
No relevant information.
[Information on payments and unpaid balances for reported segments.]
No relevant information.
[Information on incidental gains for reported segments.]
No relevant information.
( Profit and Loss Regarding Corporate Equity Principles )
As there are no companies associated to this business, there is no relevant information.
( Information on Related Parties )
Transactions with Related Parties
Corporated filed financial statements and transactions with related parties.
Prev. Fiscal Year (10/1/2015 ~ 9/30/2016)
| Category | Company Name | Location | Stock or Capital (1000 yen) |
Operational Industry | Voting Access Percentage (%) | Connection of Related Party | Transaction Details | Transaction Amount (1000 yen) | Subject | End of Term Balance (1000 yen) |
|---|---|---|---|---|---|---|---|---|---|---|
| Corporation with Large Stock Numbers and/or Voting Rights | KSK | Saitama | 10,000 | Manufacturing | None | Executive Post | Consigned goods for game development (Note #2) | 17,450 | Arrears | 864 |
Notes:
1. The above transaction amounts include tax, and end-of-term balance also includes tax.
2. In this case, individual items are estimations based on quotes from other companies that were determined through negotiations.
This Fiscal Year (10/1/2016 ~ 9/30/2017)
| Category | Company Name | Location | Stock or Capital (1000 yen) |
Operational Industry | Voting Access Percentage (%) | Connection of Related Party | Transaction Details | Transaction Amount (1000 yen) | Subject | End of Term Balance (1000 yen) |
|---|---|---|---|---|---|---|---|---|---|---|
| Corporation with Large Stock Numbers and/or Voting Rights | KSK | Saitama | 10,000 | Manufacturing | None | Executive Post | Consigned goods for game development (Note #2) | 23,400 | Arrears | 1,512 |
Notes:
1. The above transaction amounts include tax, and end-of-term balance also includes tax.
2. In this case, individual items are estimations based on quotes from other companies that were determined through negotiations.
( Information on 1 Share Amounts )
| Prev. Year (10/1/2015 ~ 9/30/2016) | This Year (10/1/2016 ~ 9/30/2017) |
|---|---|
| Net Worth per Share : 373.57 yen | Net Worth per Share : 429.08 yen |
| Net Income per Share : 37.64 yen | Net Income per Share : 62.51 yen |
Notes:
1. Potential stock adjustment is based on the cost of shares based on net income, however as there is no potential stock, there is no relevant information.
2. The basic calculations for net income per share can be found below.
| Item | Prev. Year (10/1/2015 ~ 9/30/2016) | This Year (10/1/2016 ~ 9/30/2017) |
|---|---|---|
| Net Income per Share | ||
| Net Income (1000 yen) | 386,907 | 642,601 |
| Money Returned to General Shareholders (1000 yen) | — | |
| Term’s Net Profit Affected by General Stock (1000 yen) | 386,907 | 642,601 |
| Average Stock Count During Term | 10,279,898 | 10,279,898 |
( Essential Late-Starting Events )
No relevant information.
( 6 ) Miscellaneous
State of Production, Orders, and Sales
a. Production Results
The primary work of this company is in research and development. There are no production facilities in this company’s possession.
b. Order Results
As this company does not do made-to-order production there is no relevant information.
c. Sales Results
Details on this company’s sales results can be found below.
| Business Division | Prev. Year (10/1/2015 ~ 9/30/2016) | This Year (10/1/2016 ~ 9/30/2017) | Comparative Fluctuations | |
|---|---|---|---|---|
| Cash Amount (1000 yen) | Cash Amount (1000 yen) | Cash Amount (1000 yen) | Change (%) | |
| Manufactured Goods | 817,068 | 1,143,324 | 326,255 | 39.9 |
| Licensing | 647,113 | 913,059 | 265,945 | 41.1 |
| Total | 1,464,182 | 2,056,383 | 592,201 | 40.4 |
Notes:
1?The above-mentioned cash amounts do not include taxes.
2. The sales amounts and corresponding results related to the previous two fiscal years can be seen below.
| Partner | Prev. Year (10/1/2015 ~ 9/30/2016) | This Year (10/1/2016 ~ 9/30/2017) | ||
|---|---|---|---|---|
| Cash Amount (1000 yen) | Ratio (%) | Cash Amount (1000 yen) | Ratio (%) | |
| Konami Digital Entertainment | 694,711 | 47.4 | 1,055,089 | 51.3 |
| Sony Interactive Entertainment | 282,677 | 19.3 | 490,547 | 23.9 |
[ Falcom EOY 2017 Financial Report (PDF) ]
[ EOY Report Summary ]
Footnotes
| ↑1 | Code used on the Tokyo Stock Exchange. |
|---|---|
| ↑2 | as a note, this is from a Japanese standpoint- ‘domestic’ is for Japan |
| ↑3 | approx. $18,340,000, as of 12/15/2017 |
| ↑4, ↑20 | approx. $8,600,000 as of 12/15/2017 |
| ↑5, ↑18 | approx. $5,700,000 as of 12/15/2017 |
| ↑6 | Trails of Cold Steel in English |
| ↑7 | approx. $10,150,000 as of 12/15/2017 |
| ↑8 | approx. $8,100,000 as of 12/15/2017 |
| ↑9 | approx. $15,980,000 as of 12/15/2017 |
| ↑10 | approx. $6,660,000 as of 12/15/2017 |
| ↑11 | approx $4,440,000 as of 12/15/2017 |
| ↑12 | approx. $44,600,000 as of 12/15/2017 |
| ↑13 | approx. $5,430,000 as of 12/15/2017 |
| ↑14 | approx. $1,080,000 as of 12/15/2017 |
| ↑15 | approx. $1,320,000 as of 12/15/2017 |
| ↑16 | approx. $39,160,800 as of 12/15/2017 |
| ↑17 | approx. $630,000 as of 12/15/2017 |
| ↑19 | approx $34,160,000 as of 12/15/2017 |
| ↑21 | thanks to Sniff the Raven for assisting me with this to try to make this financial jargon word salad sound less like a word salad. |