

On 8/9/2017, Falcom released their earnings report for Quarter 3 (10/1/2016 ~ 6/30/2017) on their IR report page. The actual report can be found listed at the bottom of the article in PDF form. While Q3 is still a relatively quiet period for Falcom, as they are building up for their final release of the financial year in Q4, Q3 still saw several big releases. In Japan, Ys VIII was released for PlayStation 4, and both Trails in the Sky the 3rd for Steam and Tokyo Xanadu for PS Vita were released in the west.
Timeframe: 10/1/2016 ~ 6/30/2017
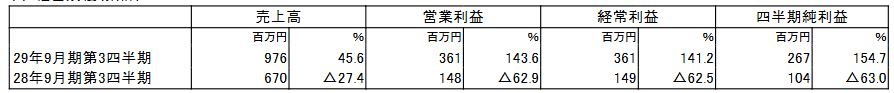
Percentage represents fluctuations between the quarters over the previous year.
Presented in 1 million yen increments
All conversions are approximates based on $1 = 109.9 yen (current on 8/9/2017)
| Total Sales | Operating Profit | Operating Income | Quarter Net Income | |||||
|---|---|---|---|---|---|---|---|---|
| 2017 Q3 Results | 976 ($8.9m) |
45.6% | 361 ($3.3m) |
143.6% | 361 ($3.3m) |
141.2% | 267 ($2.4m) |
154.7% |
| 2016 Q3 Results | 670 ($6.1m) |
? 27.4% | 148 ($1.3m) |
? 62.9% | 149 ($1.4m) |
? 64.5% | 104 ($0.9m) |
? 63.0% |
Additional information and number details/explanations can be found below the cut.
(In 1 yen increments)
| Q3 Net Income Per Share | Potential Stock Adjustment On Q3 Net Income Per Share |
|
|---|---|---|
| 2017 Q3 | 25.98 | — |
| 2016 Q3 | 10.20 | — |
Financial Condition
| Total Assets (1 mil yen) |
Net Asset Value (1 mil yen) |
Capital-to-Asset Ratio | Net Assets per Share (1 yen) |
|
|---|---|---|---|---|
| 2017 Period, Q3 | 4,277 | 4,035 | 94.3% | 392.56 |
| 2016 Period | 4,155 | 3,840 | 92.4% | 373.57 |
(Reference) Net Worth — 2017 Q3: 4,035 million yen. 2016: 3,840 million yen.
State of Dividends
In 1 yen increments
| Yearly Dividends | |||||
|---|---|---|---|---|---|
| End of Q1 | End of Q2 | End of Q3 | End of Term | Total | |
| 2016 Period | — | 0.00 | — | 7.00 | 7.00 |
| 2017 Period | — | 0.00 | — | ||
| 2017 Forecast | 5.00 | 5.00 | |||
Annotation: No dividend forecast adjustments based on recent announcements.
General dividend breakdown is 5 yen per share, with a commemorative additional 2 yen per share.
EOY Forecast for 2017
| Total Sales | Operating Profit | Operating Income | EOY Net Income | Net Profit per Share |
||||
|---|---|---|---|---|---|---|---|---|
| 1,800m yen | 22.9% | 750m yen | 28.4% | 750m yen | 28.3% | 500m yen | 29.2% | 48.64 yen |
Qualitative Data Regarding the Quarterly Balance Sheet
1. Explanation of Current Business Results
This company works to create game contents and services overflowing with originality and charm, and has drawn in many customers world-wide on many different platforms.
For the manufactured goods branch during the Q3 period, users had a good reaction to the products that were released by the company itself. Games like Ys VIII -Lacrimosa of Dana- on the PlayStation Vita (released in July 2016), and Tokyo Xanadu eX+ on PlayStation 4 (released in September 2016) continued to see sales over the year. Furthermore, in May 2017, Ys VIII -Lacrimosa of Dana- was released to PlayStation 4, as well.
Further more, sales continue with Trails of Cold Steel and Trails of Cold Steel II, which have seen a total of over 1,000,000 copies sold cumulatively. This is leading in to the release of Sen no Kiseki III on the PlayStation 4, which has seen over 60,000,000 units sold worldwide.
With all of this, the sales for manufactured goods for Q3 2017 come out to 333 million yen. (A 54% increase from last year.)
Regarding licensed goods, for portable consoles Ys VIII -Lacrimosa of Dana- was released to the PlayStation Vita in Korea, and Gurumin 3D was released to the 3DS in both English and Japanese. In February 2017, Ys Origin was released in Japanese and other languages. In March 2017, Tokyo Xanadu on the PlayStation Vita and Tokyo Xanadu eX+ on PlayStation 4 were both released in Chinese, with a Korean release following up in April 2017.
In March 2017, Ys VIII -Lacrimosa of Dana- was released in both Chinese and Korean simultaneously with the Japanese release. Additionally, Ys Origin was released in Japanese and other languages to the PlayStation Vita.
To add to this, older Falcom titles are being released in English for PC, as well as continued development for the online Story RPG Akatsuki no Kiseki, and other collaborations, like Hortensia Saga, Seven Knights, Taiko no Tatsujin V Version, Lapinous Chronicle, and other titles.
With all of this, the sales for licensed goods for Q3 2017 come out to 642 million yen. (A 41.4% increase from last year.)
2. Explanation Regarding Financial Condition
(Total Assets)
Total assets at the end of Q3 are primarily affected by accounts receivable having 106 million yen, totaling the assets to 4,227 million yen. (An increase of 2.9% from the previous fiscal year.)
(Debts)
This Q3 term ended with primarily a decrease in accounts payable, totally to 2 million yen, and a decrease in unpaid government taxes coming to 88 million yen. The end total of debts is 242 million yen. (A decrease of 23.2% from the previous fiscal year.)
(Net Worth)
The net worth for Q3 comes from 71 million yen of dividend payments and 267 million yen from a quarterly net income. This totals to 4,035 million yen. (Up 5.1% from the previous fiscal year.)
3. Information Regarding Earnings Forecast and Predictions
There is nothing to announce as there are no expected changes to the earnings forecast released on 11/10/2016.
Detailed Financial Summary
Quarterly Balance Sheet
In thousand yen increments
| Prev. Year (2016) | Current Year (2017) As of 6/30/2017 |
|
|---|---|---|
| Property Division | ||
| Current Assets | ||
| Cash on Hand | 3,812,687 | 3,812,639 |
| Accounts Receivable | 137,653 | 244,312 |
| Manufactured Goods | 1,301 | 1,158 |
| Raw Materials | 1,994 | 1,899 |
| Misc. | 42,278 | 50,396 |
| Current Assets Sum | 3,995,916 | 4,110,405 |
| Fixed Assets | ||
| Tangible Fixed Assets | 4,564 | 8,184 |
| Intangible Fixed Assets | 3,210 | 1,717 |
| Assets from Additional Investments | 152,185 | 157,445 |
| Sum of Fixed Assets | 159,961 | 167,358 |
| Total Assets | 4,155,877 | 4,277,763 |
| Debt Division | ||
| Current Liabilities | ||
| Accounts Payable | 22,952 | 20,462 |
| Unpaid Corporate Taxes | 150,838 | 62,316 |
| Reward Provisions | 20,250 | 6,000 |
| Miscellaneous | 121,549 | 153,547 |
| Sum of Current Liabilities | 315,590 | 242,326 |
| Total Debts | 315,590 | 242,326 |
| Net Worth Division | ||
| Shareholder Equity | ||
| Capital Stock | 164,130 | 164,130 |
| Capital Surplus | 319,363 | 319,363 |
| Profit Surplus | 3,356,910 | 3,552,061 |
| Treasury Stock | ? 117 | ? 117 |
| Sum of Shareholder Equity | 3,840,286 | 4,035,437 |
| Sum of Net Worth | 3,840,286 | 4,035,437 |
| Liabilities and Net Worth Sum | 4,155,877 | 4,277,763 |
Quarterly Profit and Loss Statement
In thousand yen increments
| Prev. Q3 (2016) 10/1/2015~6/30/2016 |
Current Q3 (2017) 10/1/2016~6/30/2017 |
|
|---|---|---|
| Sales | 670,629 | 976,722 |
| Cost of Sales | 92,804 | 83,151 |
| Sales Profit | 577,825 | 893,571 |
| Sales Expenses and Admin Costs | 429,228 | 531,628 |
| Operating Profit | 141,596 | 361,942 |
| Earnings Outside of Business | ||
| Received Interest | 332 | 18 |
| Received Dividends | 572 | 1,155 |
| Profits Excluded from Unpaid Dividends | 702 | 1,046 |
| Sum of Earnings Outside of Business | 1,606 | 2,220 |
| Expenses Outside of Business | ||
| Currency Exchange Losses | 378 | 2,818 |
| Sum of Expenses Outside of Business | 378 | 2,818 |
| Operating Income | 149,825 | 361,344 |
| Quarterly Income Before Taxes | 149,825 | 361,344 |
| Corporation, Municiple, and Other Enterprise Taxes | 26,094 | 99,838 |
| Taxes and Adjustments | 18,837 | ? 5,603 |
| Sum of Corporate Taxes | 44,932 | 94,234 |
| Quarterly Net Profit | 104,892 | 267,110 |
[ Falcom IR Report Page ]
[ Falcom 2017 Q3 Financial Statement (PDF) ]
So…
Falcom is in good shape then?
I have a curiosity. Are steam games making a profit for Falcom?